ZondIP1d
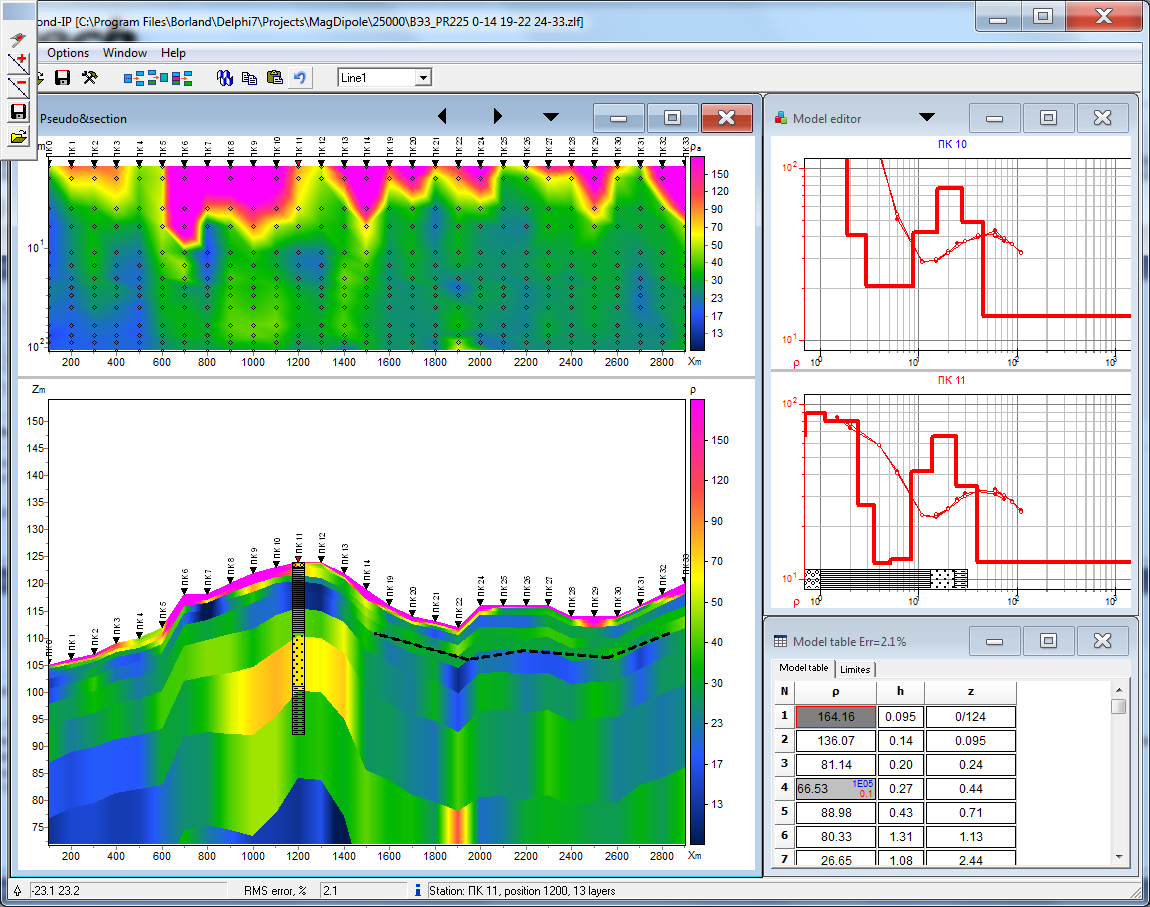
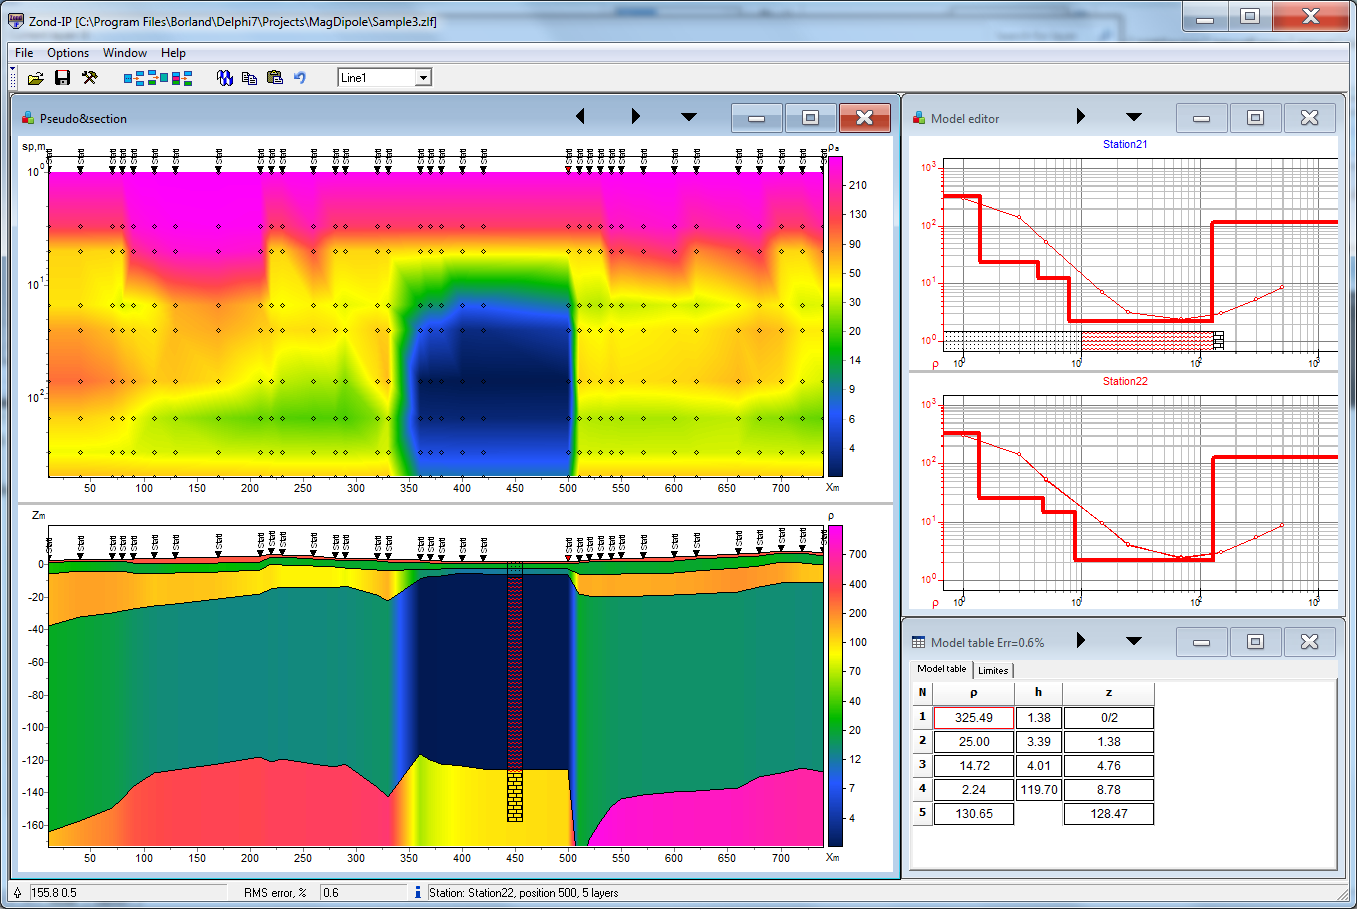
Zondip1d program is designed for one-dimensional resistivity and induced polarization vertical electrosounding data interpretation (with taking account frequency).
A method of the vertical electrosounding (VES) is one of the oldest methods of electric prospecting. The first applications of method were in 20th years of XX century. Comparative simplicity and evidence of VES resulted in its wide distribution and development in the whole world. Nowadays vertical electric sounding remains one of the most applied electromagnetic methods. Other modern technologies are developed on the basis of VES – for example, electrical tomography, based on the same principles that for «classic» electric soundings.
One of the basic requirements to application of geophysical methods is a contrast in physical properties of study object. For resistivity methods (including VES) it means that the studied object must be contrast in electric resistivity from host rocks [MSU, 2007].
Comfortable interface and wide possibilities of data presentation allow to solve given geological problem with maximum effectiveness. While developing software special attention was payed to comfort and simplicity of its use, variety of visualization features and account of a priori data.
Depending on the interpreter’s choice, software gives different variants of data interpretation algorithms. Comfortable control system allows to choose from the great number of equivalents results that will appear to be the best in geophysical and geological point of view. Conception of multi-station interpretation is basis of the ZondIP1D software. Consequently, profile line data is considered as a reflection of geological section. It’s mean that multi-station data of profile line is whole, and not set of separated curves. Special windowed algorithms developed for interpretation of profile line data are provided in the software with every curve segment P-effect’s reduction. But most software features can be used also during work with the separated points of VES.
Conception of multi-station interpretation is basis of the ZondIP1D software. Consequently, profile line data is considered as a reflection of geological section. It’s mean that multi-station data of profile line is whole, and not set of separated curves. Special windowed algorithms developed for interpretation of profile line data are provided in the software with every curve segment P-effect’s reduction. But most software features can be used also during work with the separated points of VES. You can use areal XY survey with arbitrary lines orientation in multi-line mode.
Zondip1d allows to work with any type of the electrodes array or their combinations. Program supports both the traditional arrays (Schlumberger, Wenner or Dipole-dipole axial) and the most exotic, with an arbitrary orientation of electrodes and mixed systems, with taking account of frequency. Electrodes (source and measuring) can be located on one line or in arbitrary configuration on the plane. Data can be imported into the program in the formats of the most popular programs such as Ipi2win, IX1D.
As the basic task of the program is inversion of geoelectric section parameters – few variants of inverse problem are realized in ZondIP1D, basic of them are: smoothed inversion – to get smooth, and focusing – to get the piece-smooth distributing of geoelectric parameters vs depth. Because of equivalence of inverse geophysical problems, quality of the obtained results strongly depends on the amount of used a priori data. In Zondip1d there is possibility of weight setting (Error gates) for measurements, fixing and limiting of different layers parameters, using of a priori model as reference in inversion. If the values of some section parameters are known exactly (a priori or on interpretation results), their fixing is possible before the beginning of automatic interpretation. The fixed parameters do not change during the process of inversion. Fixing of parameters is the method for hard regularization of inversion process. The robust schemas of noise estimation are realized in the program.
- Supporded fomats: IPI2WIN dat/DTG, USF, ABEM, VES, ES
- Unlimited soundings and spacings amount.
- Supports any kind of electrodes configurations(arbitrary XY layout), traditional and non-traditional arrays. Can be different for different soundings.
- Profile and areal surveys
- On-water and underwater surveys.
- Supports VMD low induction soundings (Hz/Hr)
- Taking in account currents frequency(0-100kHz).
- Induced polarization sounding.
- Areal data and model plotting, 3D fence diagram
- Buffer for 5 models.
- Data denoising and smoothing procedures.
- Several of the resistivity and IP inversion algorithms : smooth, focusing, robust,statistical approach. Setting the reference model for the inversion. Suppression of the noise component and static shifts effect during inversion . Special 1.5D procedures for profile inversion.
- Setting of limits for models parameters, introduction of a priori geological boundaries and borehole data to inversion. Assignment of weights for datum records.
- Different tools for statistical results analysis.
- Number of variants for data, model and apriori information visualization(section or plane). Ability to set a semi transparent background for the resistivity section or map(geological, seismic sections).
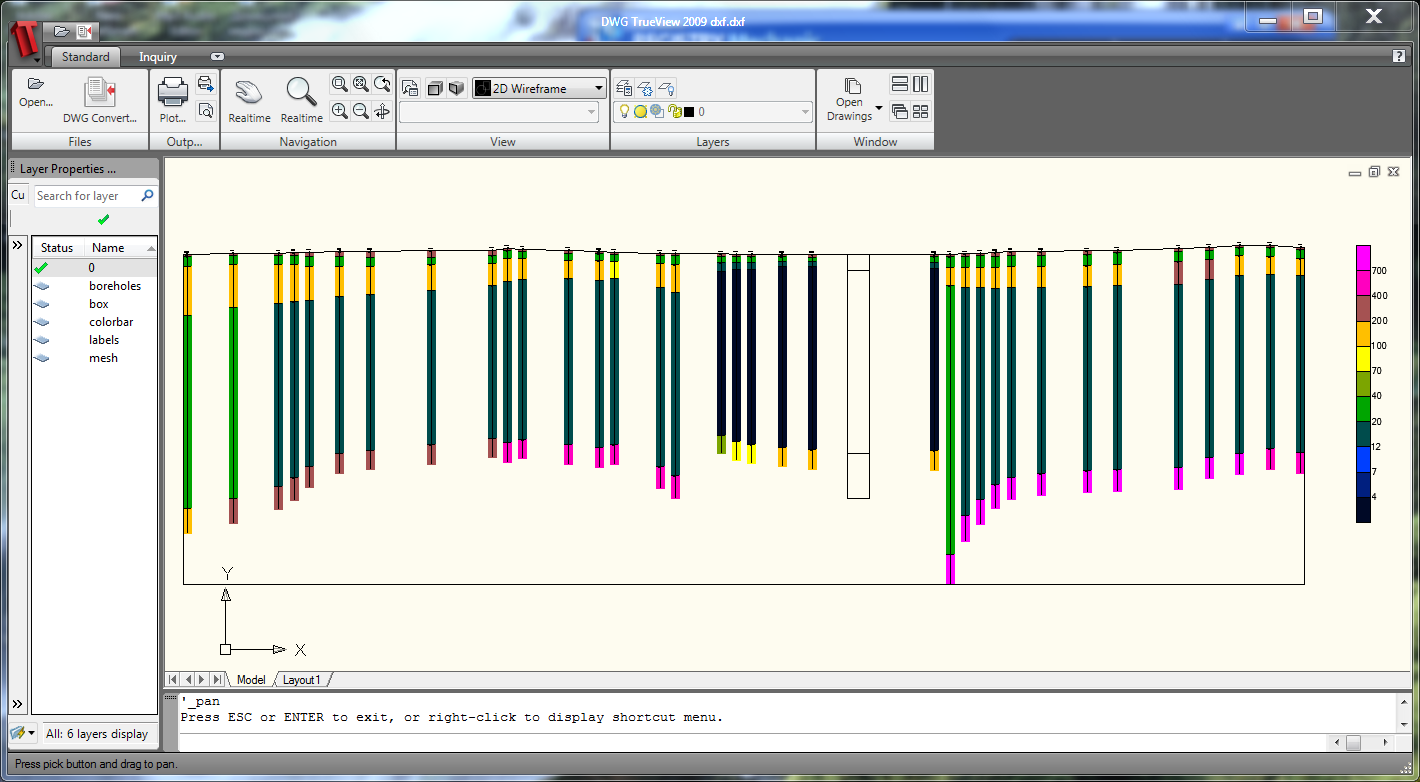
- Geological sections editor and borehole(and logging data) columns editor. Titled boreholes.
- Joint inversion with magnetotelluric data.
- Export to bitmap and vector graphics formats, excel, surfer, AUTOCAD. Setting the scale of the exported image. Print images and create reports.


